
World
Tracking coronavirus: U.S. data
The table below shows confirmed cases of coronavirus (2019-nCoV, officially known as SARS-CoV-2 or COVID-19) in the U.S. Scroll down for a graph and maps.
Charts
D.C. | Florida | Texas |
Northern Mariana Islands
We need your help:
Join us on Patreon or support us with a one-time donation on PayPal.
Click here for yesterday’s data.
- Black Circle: Counties with 10,000 or more cases
- Purple Circle: Counties with 1,000-9,999 cases
- Red Circle: Counties with 100-999 cases
Notes
- Data about the number of recoveries varies by jurisdiction. While some provide exact figures, many provide “presumed recoveries” or no data at all. To provide a more accurate picture, we apply the presumed recovery criteria to fill the gap when no data is available. Recoveries are estimated by taking into account the average duration of illness and the number of deaths. Someone is considered to have recovered when they no longer have COVID-19, though some may have conditions caused by the illness.
Follow us / Tips
- Twitter: @BNODesk and @BNONews
- YouTube / Facebook / Email Alerts
- Did we miss something? You can let us know by sending an email to [email protected]


Death toll from Venezuela double earthquake rises to nearly 4,600

U.S. sanctions 10 Cuban entities over repression and regime funding

Austin police release footage of fatal shooting of man who pointed gun at bystanders

Armed suspect killed after lunging at police officers in Oakland, California
-

 Legal2 days ago
Man shot and killed by police after pointing gun at people in Austin, Texas
-

 Legal1 week ago
6 shot, 1 killed, at San Antonio apartment complex
-
 World1 day ago
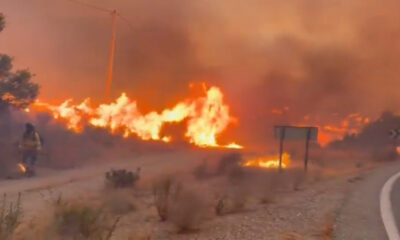
Death toll from wildfire in southern Spain rises to 13
-

 Politics7 days ago
U.S. condemns China’s submarine ICBM test into Pacific
-

 World6 days ago
Ukrainian suspect in Monaco bombing found shot dead
-

 Legal1 week ago
Police sergeant, mother and daughter killed in Ohio shooting; suspect dead
-
 Legal6 days ago
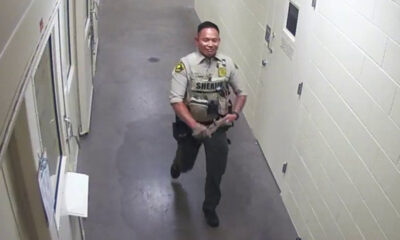
San Diego deputy sentenced for shove that fractured detainee’s spine
-
 Legal6 days ago
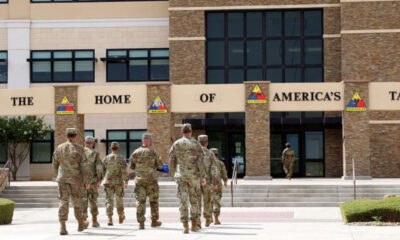
Illinois man charged with threatening to attack Fort Bliss personnel and families