
World
Tracking coronavirus: U.S. data
The table below shows confirmed cases of coronavirus (2019-nCoV, officially known as SARS-CoV-2 or COVID-19) in the U.S. Scroll down for a graph and maps.
Charts
D.C. | Florida | Texas |
Northern Mariana Islands
We need your help:
Join us on Patreon or support us with a one-time donation on PayPal.
Click here for yesterday’s data.
- Black Circle: Counties with 10,000 or more cases
- Purple Circle: Counties with 1,000-9,999 cases
- Red Circle: Counties with 100-999 cases
Notes
- Data about the number of recoveries varies by jurisdiction. While some provide exact figures, many provide “presumed recoveries” or no data at all. To provide a more accurate picture, we apply the presumed recovery criteria to fill the gap when no data is available. Recoveries are estimated by taking into account the average duration of illness and the number of deaths. Someone is considered to have recovered when they no longer have COVID-19, though some may have conditions caused by the illness.
Follow us / Tips
- Twitter: @BNODesk and @BNONews
- YouTube / Facebook / Email Alerts
- Did we miss something? You can let us know by sending an email to [email protected]


Actor James Handy killed by girlfriend’s son at Los Angeles home

Massive explosion reported at suspected fuel theft site in Mexico

U.S. sanctions Cuban President Miguel Díaz-Canel

Amazon employee shot and killed in fulfillment center garage near Chicago
-

 World6 days ago
Dutch police review arrest after pregnant woman thrown to ground in viral video
-

 World1 week ago
2 injured after Russian drone hits apartment building in Romania
-

 World5 days ago
U.S. citizen killed in shootout near Cabo tourist area in Mexico
-

 US News6 days ago
3 Latvian climbers killed in fall on Denali in Alaska; others injured
-
 Legal4 days ago
2 officers, police K-9 injured in Virginia shooting
-

 US News1 week ago
11 presumed dead after chemical tank blast at Washington plant, river contaminated
-
 US News5 days ago
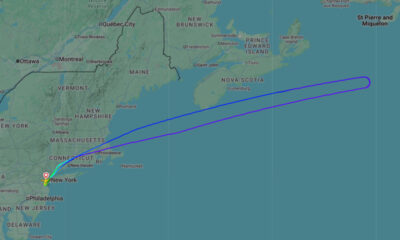
United flight turns around over Atlantic after Bluetooth device named BOMB
-
 Legal4 days ago
3 killed, officer wounded in shooting in Sandy, Oregon