
World
Tracking coronavirus: U.S. data
The table below shows confirmed cases of coronavirus (2019-nCoV, officially known as SARS-CoV-2 or COVID-19) in the U.S. Scroll down for a graph and maps.
Charts
D.C. | Florida | Texas |
Northern Mariana Islands
We need your help:
Join us on Patreon or support us with a one-time donation on PayPal.
Click here for yesterday’s data.
- Black Circle: Counties with 10,000 or more cases
- Purple Circle: Counties with 1,000-9,999 cases
- Red Circle: Counties with 100-999 cases
Notes
- Data about the number of recoveries varies by jurisdiction. While some provide exact figures, many provide “presumed recoveries” or no data at all. To provide a more accurate picture, we apply the presumed recovery criteria to fill the gap when no data is available. Recoveries are estimated by taking into account the average duration of illness and the number of deaths. Someone is considered to have recovered when they no longer have COVID-19, though some may have conditions caused by the illness.
Follow us / Tips
- Twitter: @BNODesk and @BNONews
- YouTube / Facebook / Email Alerts
- Did we miss something? You can let us know by sending an email to [email protected]


Fire breaks out at Raleigh Convention Center in North Carolina

More than 1,270 dead from cyclones in South and Southeast Asia

Death toll in Hong Kong residential complex rises to 151

Police officer shot in Port St. Lucie, Florida
-
 World1 week ago
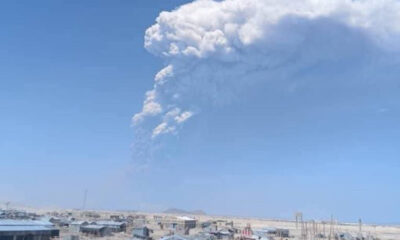
Ethiopian volcano erupts for first time in thousands of years
-

 Legal6 days ago
Utah Amber Alert: Jessika Francisco abducted by sex offender in Ogden
-

 US News5 days ago
Explosion destroys home in Oakland, Maine; at least 1 injured
-
 Health5 days ago
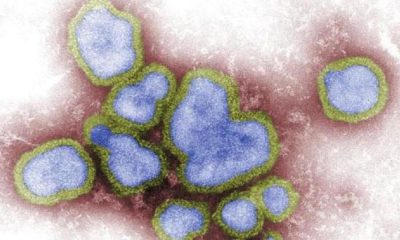
Mexico’s September human bird flu case confirmed as H5N2
-

 Health15 hours ago
8 kittens die of H5N1 bird flu in the Netherlands
-

 Legal2 days ago
15 people shot, 4 killed, at birthday party in Stockton, California
-

 World6 days ago
Woman killed, man seriously injured in shark attack on Australia’s NSW coast
-
 Health5 days ago
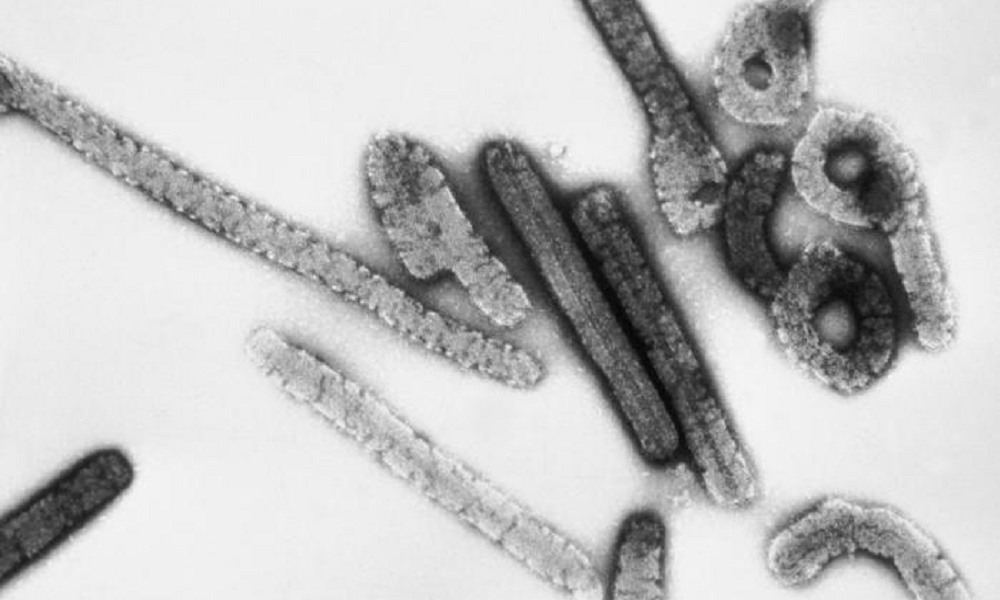
Marburg outbreak in Ethiopia rises to 12 cases and 8 deaths