


NOTE: This page is no longer being updated. The table below shows confirmed cases of COVID-19 reinfection. The first confirmed case of reinfection was reported in...

The table below shows cases of coronavirus (officially known as SARS-CoV-2, COVID-19, or 2019-nCoV) around the world. Each figure is verified by our team through local...
The visualizations below are of coronavirus (2019-nCoV, officially known as SARS-CoV-2 or COVID-19) in the U.S. Note: These visualizations are best viewed on a desktop/tablet device....
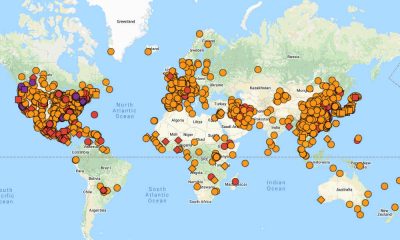
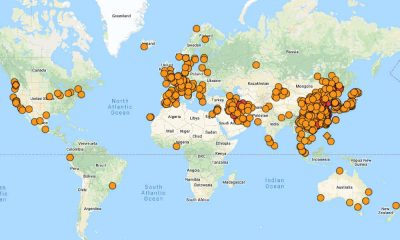
The visualizations below are of coronavirus (2019-nCoV, officially known as SARS-CoV-2 or COVID-19) around the world. U.S. Real-time visualizations, click hereFor a breakdown of the information...
The chart below show the progression of coronavirus (2019-nCoV, officially known as SARS-CoV-2 or COVID-19) in the Northern Mariana Islands. For nationwide figures and charts for...
The charts below show the progression of coronavirus (2019-nCoV, officially known as SARS-CoV-2 or COVID-19) in Washington, District of Columbia (D.C.). For nationwide figures and charts...
The chart below show the progression of coronavirus (2019-nCoV, officially known as SARS-CoV-2 or COVID-19) in Florida. For nationwide figures and charts for other U.S. states,...
The chart below show the progression of coronavirus (2019-nCoV, officially known as SARS-CoV-2 or COVID-19) in Texas. For nationwide figures and charts for other U.S. states,...


The following is a timeline of new cases in China and around the world since 28 March. For cases prior to March 28, click here for...

The table below shows confirmed cases of coronavirus (2019-nCoV, officially known as SARS-CoV-2 or COVID-19) in Canada. For all data tables, click here.For real-time visualizations, click...