
World
Tracking coronavirus: U.S. data
The table below shows confirmed cases of coronavirus (2019-nCoV, officially known as SARS-CoV-2 or COVID-19) in the U.S. Scroll down for a graph and maps.
Charts
D.C. | Florida | Texas |
Northern Mariana Islands
We need your help:
Join us on Patreon or support us with a one-time donation on PayPal.
Click here for yesterday’s data.
- Black Circle: Counties with 10,000 or more cases
- Purple Circle: Counties with 1,000-9,999 cases
- Red Circle: Counties with 100-999 cases
Notes
- Data about the number of recoveries varies by jurisdiction. While some provide exact figures, many provide “presumed recoveries” or no data at all. To provide a more accurate picture, we apply the presumed recovery criteria to fill the gap when no data is available. Recoveries are estimated by taking into account the average duration of illness and the number of deaths. Someone is considered to have recovered when they no longer have COVID-19, though some may have conditions caused by the illness.
Follow us / Tips
- Twitter: @BNODesk and @BNONews
- YouTube / Facebook / Email Alerts
- Did we miss something? You can let us know by sending an email to [email protected]


U.S. MQ-9 Reaper crashes off South Korean coast during routine mission

Trump orders review of Muslim Brotherhood chapters for possible terror designations

Afghanistan says Pakistani airstrike killed 10 civilians near border

Trump signs order creating national “Genesis Mission” for AI research
-
 World2 days ago
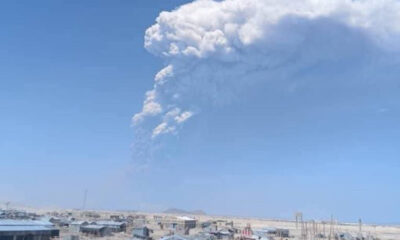
Ethiopian volcano erupts for first time in thousands of years
-

 Legal1 week ago
Michigan man JD Vance sentenced to 2 years for threatening Trump and JD Vance
-

 Politics1 week ago
U.S. to designate Maduro-linked Cartel de los Soles as terrorist organization
-

 Health1 week ago
Cambodia reports fatal H5N1 bird flu case in 22-year-old man
-

 Legal6 days ago
Woman in critical condition after being set on fire on Chicago train
-
 World6 days ago
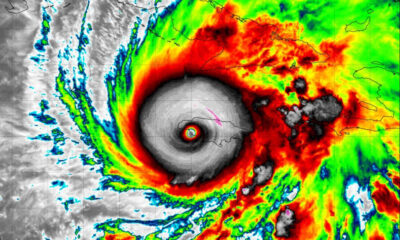
Hurricane Melissa registered 252 mph wind gust, breaking global record
-

 Politics1 week ago
Epstein survivors release PSA calling on Congress to release all files
-

 Legal5 days ago
Suspect in San Diego stabbing shot by authorities after fleeing into Mexico